https://kr.mathworks.com/help/matlab/creating_guis/polar-plotting-app-gui-in-app-designer.html
프로그래밍 방식으로 극좌표 좌표축 생성하기 - MATLAB & Simulink - MathWorks 한국
이 예제의 수정된 버전이 있습니다. 사용자가 편집한 내용을 반영하여 이 예제를 여시겠습니까?
kr.mathworks.com
핵심코드
1) Properties (Access = Private)
프로그램 코드 작성 시 사용할 변수 선언
properties (Access = private) Pax end |
2) methods (Access = Private)
2-1)
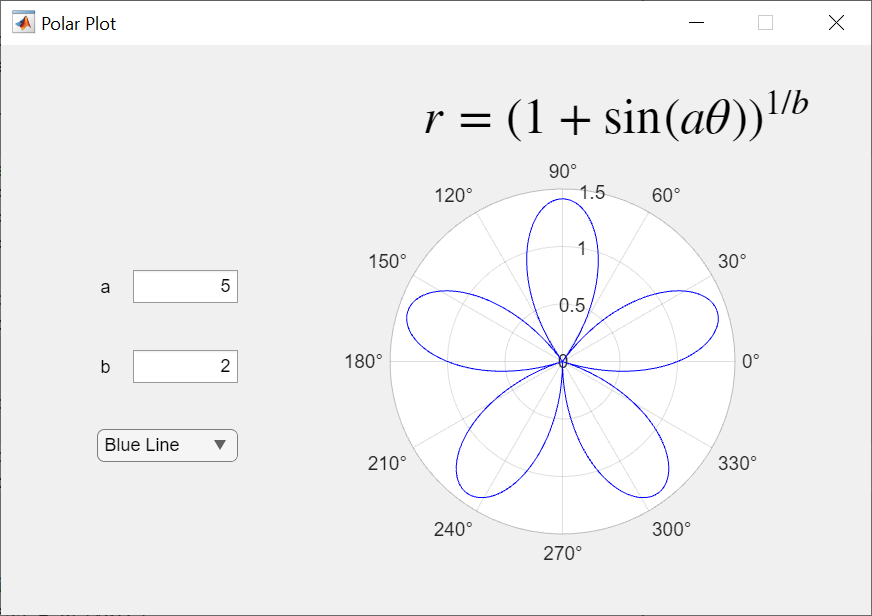
function updateplot(app) % Define theta. Get a and b theta = 0:pi/1800:2*pi; a = app.aEditField.Value; b = app.bEditField.Value; % Calculate r and plot it r = (1 + sin(a.*theta)).^(1/b); plotline = polarplot(app.Pax,theta,r); % Set line color plotline.Color = app.DropDown.Value; end |
3) Callback Function
3-1) 앱이 시작될 때 데이터 로딩 및 초기화를 수행하는 기능
function startupFcn(app) % Create polar axes and position it in pixels app.Pax = polaraxes(app.UIFigure); app.Pax.Units = "pixels"; app.Pax.Position = [260 55 230 230]; % Plot the polar function updateplot(app); end |
3-2) Value값이 변할 때 호출되는 함수
function ComponentValueChanged(app, event) % Plot the polar function updateplot(app); end |


