13. 떡볶이 프랜차이즈 입점전략 관련 데이터 분석 예제
import pandas as pd
# 데이터 df로 변환
df = pd.read_csv('/content/소상공인시장진흥공단_상가(상권)정보_서울_202303.csv')
# 데이터 불러오기
df
# 데이터 정보 확인
df.info()
# 떡볶이집의 이름으로 shop을 만듦
shop = ['엽기떡볶이', '신전떡볶이', '죠스떡볶이', '국대떡볶이', '감탄떡볶이']
# 파리바게뜨 데이터 필터링 (파리바게뜨나 파리바게트라는 이름의 업소명, 업소번호, 경도, 위도를 불러옴)
# df_paris
# 상가업소번호, 경도, 위도
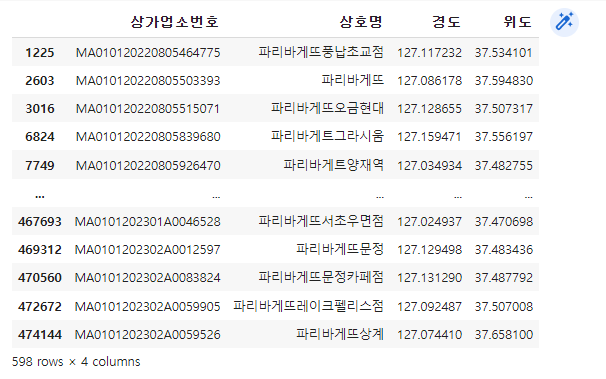
cont1 = df['상호명'].str.contains(r'파리바게뜨|파리바게트')
df_paris = df.loc[cont1, ['상가업소번호', '상호명', '경도', '위도']].copy()
df_paris
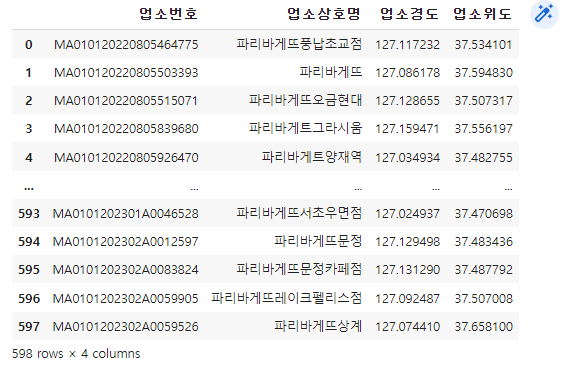
# 열의 이름을 바꾸고, 인덱스도 깔끔하게 새로 바꿈
df_paris = df_paris.set_axis(['업소번호', '업소상호명',
'업소경도', '업소위도'], axis=1).reset_index(drop=True)
df_paris
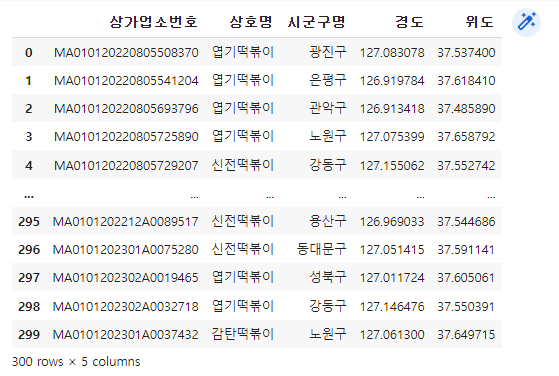
# 떡볶이 프랜차이드 데이터 필터링
(['엽기떡볶이', '신전떡볶이', '죠스떡볶이', '국대떡볶이', '감탄떡볶이']를 찾음)
extract(): 특정 문자열을 포함하고 있다면 그 문자열을 반환하고, 포함하고있지 않다면 NaN을 반환.
df_shop = df.copy()
df_shop['상호명'] = df_shop['상호명'].str.extract(r'({})'.format('|'.join(shop)))[0]
df_shop = df_shop.dropna(subset=['상호명']).iloc[:,[0, 1, 14, 37, 38]].reset_index(drop=True)
df_shop
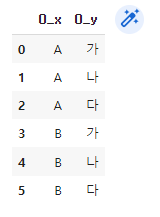
# 곱집합 / 가는 길에 대한 모든 경로를 만들어줌
df1 = pd.DataFrame(['A', 'B'])
df2 = pd.DataFrame(['가', '나', '다'])

df1.merge(df2, how='cross')
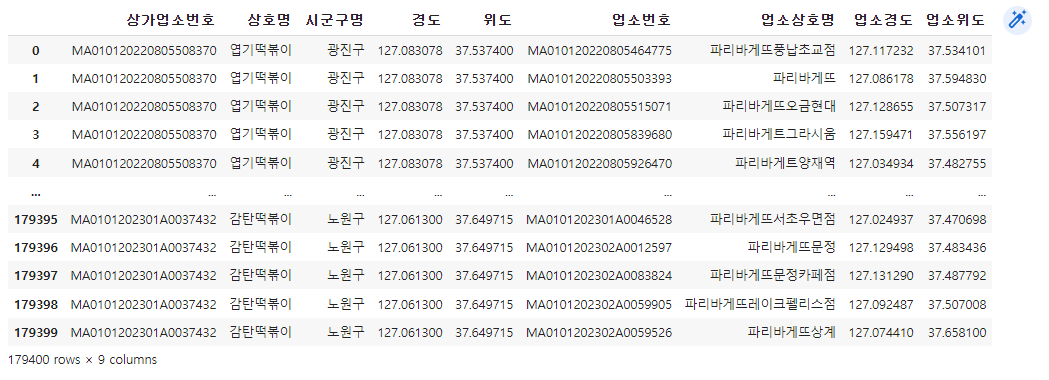
# 파리바게뜨와 떡볶이집의 병합
df_cross = df_shop.merge(df_paris, how='cross')
df_cross
# 두 지점의 위도/경도를 입력하면 거리를 구해주는 라이브러리 설치
!pip install haversine
from haversine import haversine
# 서울과 파리의 위도/경도를 입력해서 거리를 구하는 예시
seoul = [37.541, 126.986]
paris = [48.8567, 2.3508]
haversine(seoul, paris, unit='km')
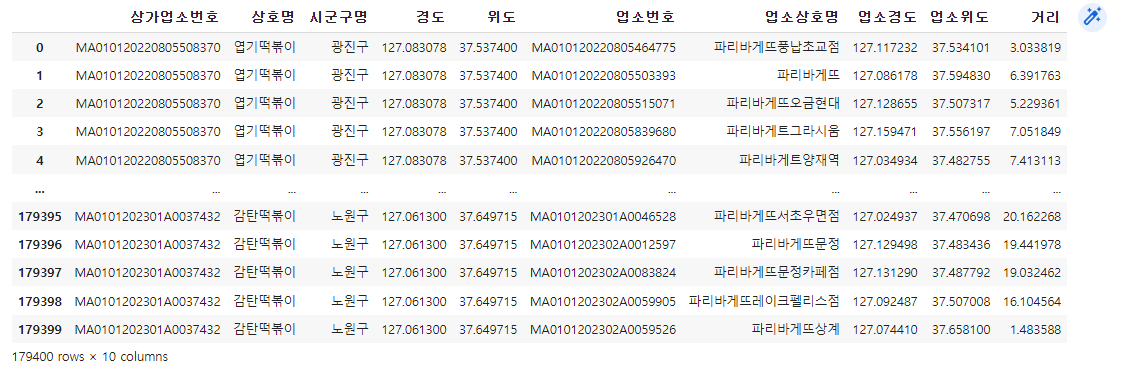
# '거리'를 파생변수로 만든 후 km단위로 확인
df_cross['거리'] = df_cross.apply(lambda x: haversine([x[4], x[3]], [x[8],x[7]], unit='km'), axis=1)
df_cross
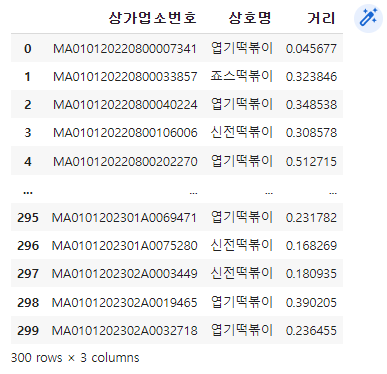
# 개별 떡볶이 매장과 파리바게뜨와의 거리
df_dis = df_cross.groupby(['상가업소번호', '상호명'])['거리'].min().reset_index()
df_dis
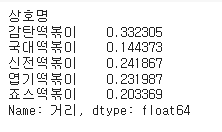
# 각 프랜차이즈별 파리바게뜨와의 평균 거리
df_dis.groupby(['상호명'])['거리'].mean()
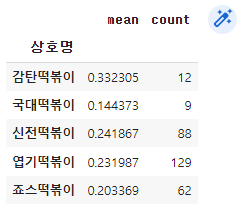
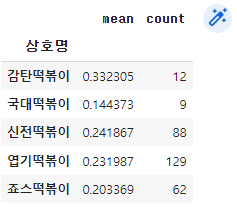
agg(): 다중집계작업 (여러 개를 한꺼번에 계산)
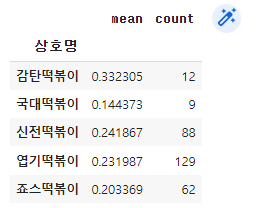
df_dis.groupby('상호명')['거리'].agg(['mean', 'count'])
# 프랜차이즈별 파리바게뜨와 50m 이하인 매장의 평균거리와 매장 개수
dis = df_dis['거리']<=50
df_dis[dis].groupby('상호명')['거리'].agg(['mean', 'count'])
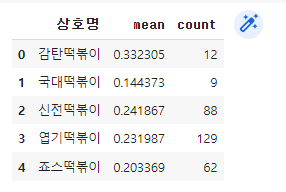
# 거리를 입력하면 프랜차이즈별 파리바게뜨와의 평균거리와 매장개수를 출력(함수는 distance)
def distance(x):
    dis = df_dis['거리']<=x
    return df_dis[dis].groupby('상호명')['거리'].agg(['mean', 'count'])
distance(10)
!pip install pandasecharts
from pyecharts.charts import Timeline, Grid
from pandasecharts import echart
import IPython
df_50 = distance(50).reset_index()
df_50
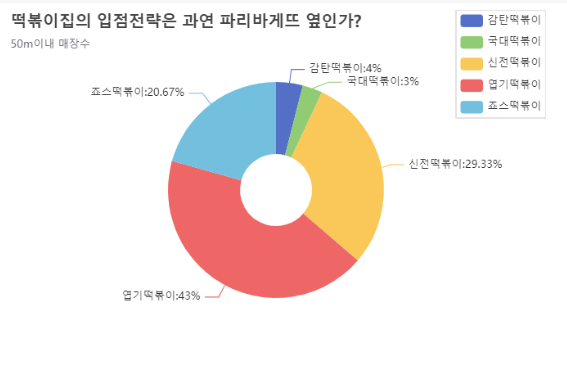
df_50.echart.pie(x='상호명', y='count', figsize=(600,400),
                radius=['20%', '60%'], label_opts={'position':'outer'},
                title='떡볶이집의 입점전략은 과연 파리바게뜨 옆인가?',
                legend_opts={'pos_right':'0%', 'orient':'vertical'},
                subtitle='50m이내 매장수').render()
IPython.display.HTML(filename='render.html')
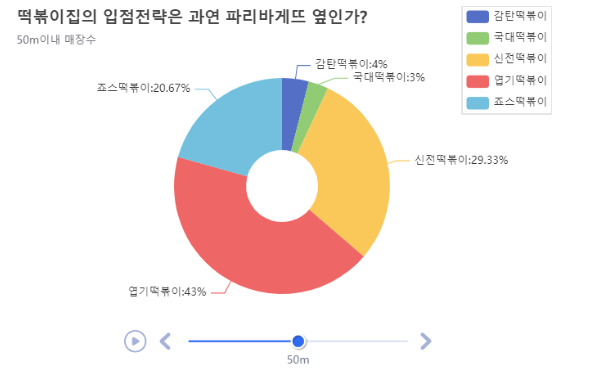
# 타임라인 작성
tl = Timeline({'width':'600px', 'height':'400px'})

pie1 = df_50.echart.pie(x='상호명', y='count', figsize=(600,400),
                radius=['20%', '60%'], label_opts={'position':'outer'},
                title='떡볶이집의 입점전략은 과연 파리바게뜨 옆인가?',
                legend_opts={'pos_right':'0%', 'orient':'vertical'},
                subtitle='50m이내 매장수')
tl.add(pie1, '50m').render()
IPython.display.HTML(filename='render.html')
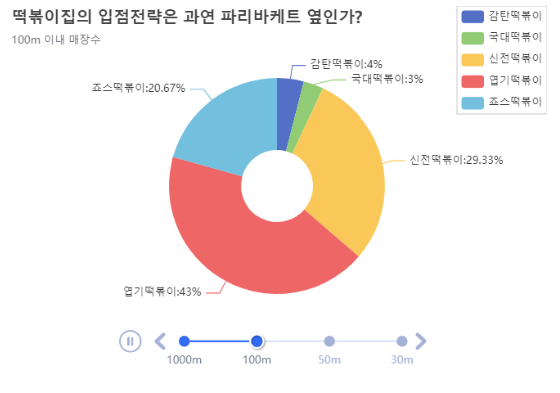
# 반복문 작성
tl = Timeline({'width':'600px', 'height':'400px'})
for i in [1000, 100, 50, 30]:
    df_d = distance(i).reset_index()
    pie1 = df_d.echart.pie(x='상호명', y='count', figsize=(600, 400),
                    radius=['20%', '60%'], label_opts={'position':'outer'},
                    title='떡볶이집의 입점전략은 과연 파리바케트 옆인가?',
                    legend_opts={'pos_right':'0%', 'orient':'vertical'},
                    subtitle='{}m 이내 매장수'.format(i))
    tl.add(pie1, '{}m'.format(i)).render()
IPython.display.HTML(filename='render.html')