11. 따릉이 API를 이용한 데이터 분석 예제
API(Application Programming Interface): 여러 프로그램/DB/기능의 상호통신방법을 정하고 도와주는 매개체 |
11-1. 따릉이 API 접속하기
https://www.bikeseoul.com/app/station/getStationRealtimeStatus.do
# 필요한 라이브러리 가져오기
import requests # JS의 fetch와 유사한 역할. 서버에 내용을 요청/응답 라이브러리
import folium # 지도 생성하는 라이브러리
import json # json을 다루는 라이브러리
from pandas.io.json import json_normalize # json을 데이터프레임으로 바꿔주는 역할
import warnings
warnings.filterwarnings('ignore')
# 따릉이 위치정보를 실시간으로 받아오는 API 주소를 변수로 지정
targetSite = 'https://www.bikeseoul.com/app/station/getStationRealtimeStatus.do'
request = requests.post(targetSite, data={'stationGrpSeq':'ALL'})

# targetSite에 post방식을 요청. data=~ 에 붙여야 모든 데이터가 날아올 수 있음
print(request) # <Response [200]>: 정상접속
# request의 타입: <class 'requests.models.Response'> request이다.
print(type(request))
print(request.text) # 출력후 메모장에서 확인

11-2. 따릉이 API 분석하기
# json.loads(): json타입의 문자열데이터를 파이썬에서 처리할 수 있도록 dictionary로 변환시켜주는 메서드.
bike_json=json.loads(request.text)
print(type(bike_json)) # type이 dict로 바뀐 것을 알 수 있음.

#json_normalize(): dict타입의 데이터를 pandas 데이터프레임으로 변환
bike_df = json_normalize(bike_json, 'realtimeList') # realtimeList: 원하는 부분의 키 값
bike_df

# bike_df의 컬럼 확인
bike_df.columns
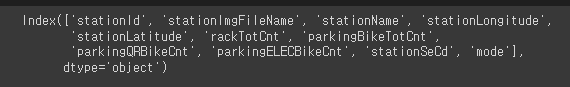
stationImgFileName: 대여소 사진 stationId: 고유한 대여소 번호 stationName: 대여소 이름 stationLongitude: 대여소 경도 stationLatitude: 대여소 위도 rackTotCnt: 주차 가능한 전체 자전거 대수 parkingBikeTotCnt: 주차된 따릉이 총 대수 parkingQRBikeCnt: 주차된 QR따릉이 총 대수 parkingELECBikeCnt: 주차된 새싹따릉이 총 대수 |
bike_df_map = bike_df[['stationName', 'stationLongitude','stationLatitude',
'rackTotCnt', 'parkingBikeTotCnt', 'parkingQRBikeCnt', 'parkingELECBikeCnt']]

bike_df_map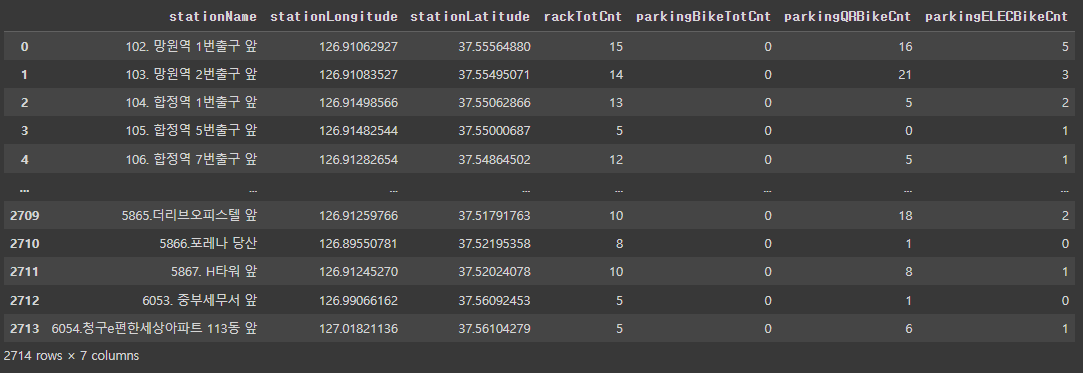
# bike_df_map의 유형
print(type(bike_df_map))
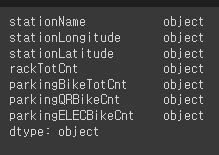
# 해당 필드의 타입들. 수정이 필요
bike_df_map.dtypes
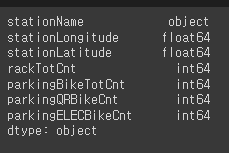
# 위도, 경도는 float로,자전거(전체, 일반, QR, 새싹따릉이 포함) 대수는 int로 변경
# total(주차된 일반자전거 + 주차된 QR따릉이 + 주차된 새싹따릉이 총 대수) 파생변수 추가.
bike_df_map['stationLongitude'] = bike_df_map['stationLongitude'].astype(float)
bike_df_map['stationLatitude'] = bike_df_map['stationLatitude'].astype(float)
bike_df_map['rackTotCnt'] = bike_df_map['rackTotCnt'].astype(int)
bike_df_map['parkingBikeTotCnt'] = bike_df_map['parkingBikeTotCnt'].astype(int)
bike_df_map['parkingQRBikeCnt'] = bike_df_map['parkingQRBikeCnt'].astype(int)
bike_df_map['parkingELECBikeCnt'] = bike_df_map['parkingELECBikeCnt'].astype(int)

bike_df_map = bike_df_map.astype({'stationLongitude':float,'stationLatitude':float,
                                  'rackTotCnt':int,'parkingBikeTotCnt':int,
                                  'parkingQRBikeCnt':int,'parkingELECBikeCnt':int})
bike_df_map.dtypes
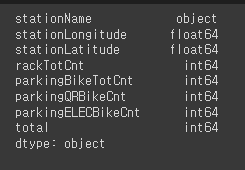
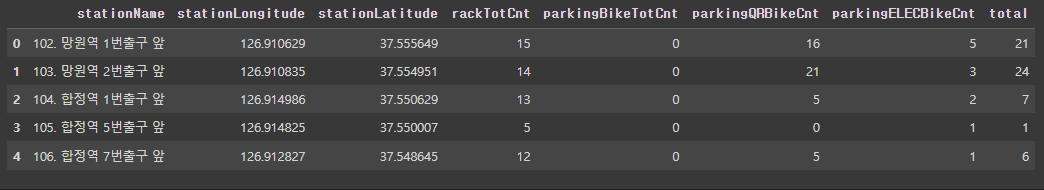
bike_df_map['total'] = bike_df_map['parkingBikeTotCnt'] + bike_df_map['parkingQRBikeCnt']
+ bike_df_map['parkingELECBikeCnt']

bike_df_map.dtypes
bike_df_map.head()
bike_df_map.shape

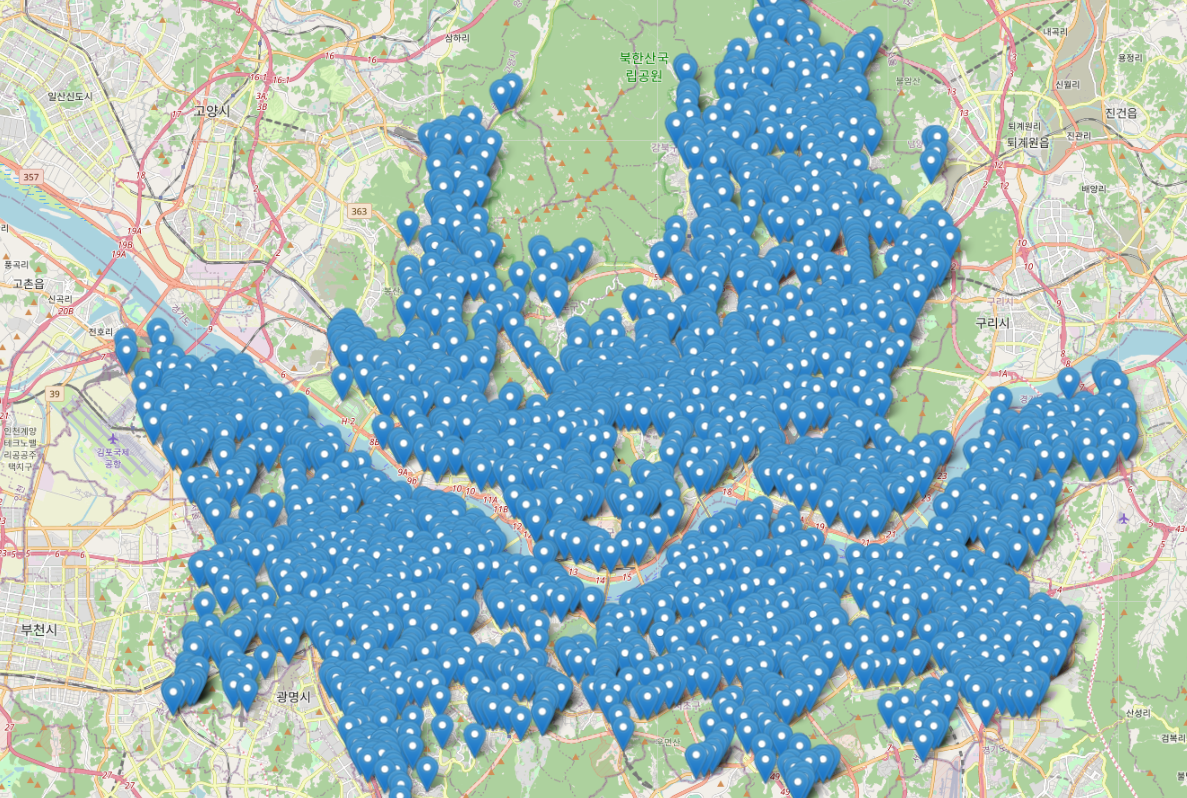
11-3. 지도에 표시하기
# 팝업 → 대여소 이름: X, 일반: X대 , QR : X대, 새싹:X대, 총 : X 대
bike_map = folium.Map(location=[bike_df_map['stationLongitude'].mean(),
bike_df_map['stationLatitude'].mean()], zoom_start=15)

for index, data in bike_df_map.iterrows():
  string = '{} 일반:{}대, QR:{}대, 새싹:{}대, 총:{}대'.format(data['stationName'],
  data['parkingBikeTotCnt'], data['parkingBikeTotCnt'], data['parkingQRBikeCnt'],
  data['parkingELECBikeCnt'])
  popup = folium.Popup(string, max_width=600)
  folium.Marker(location=[data['stationLatitude'],
  data['stationLongitude']], popup=popup).add_to(bike_map)

bike_map