0. 참고 자료
https://kr.mathworks.com/help/vision/ug/semantic-segmentation-using-deep-learning.html
딥러닝을 사용한 의미론적 분할 - MATLAB & Simulink - MathWorks 한국
이 예제의 수정된 버전이 있습니다. 사용자가 편집한 내용을 반영하여 이 예제를 여시겠습니까?
kr.mathworks.com
1. DeepLab v3 +의 사전훈련 버전을 다운로드
pretrainedURL = 'https://ssd.mathworks.com/supportfiles/vision/data/deeplabv3plusResnet18CamVid.zip'; pretrainedFolder = fullfile(tempdir,'pretrainedNetwork'); pretrainedNetworkZip = fullfile(pretrainedFolder,'deeplabv3plusResnet18CamVid.zip'); if ~exist(pretrainedNetworkZip,'file') mkdir(pretrainedFolder); disp('Downloading pretrained network (58 MB)...'); websave(pretrainedNetworkZip,pretrainedURL); end unzip(pretrainedNetworkZip, pretrainedFolder) |
2. 사전훈련된 신경망을 불러온 후, 훈련된 클래스 나열
pretrainedNetwork = fullfile(pretrainedFolder, 'deeplabv3plusResnet18CamVid.mat'); data = load(pretrainedNetwork); net = data.net; classes = string(net.Layers(end).Classes) |

3. 의미론적 영상분할(Semantic Segmentation) 수행
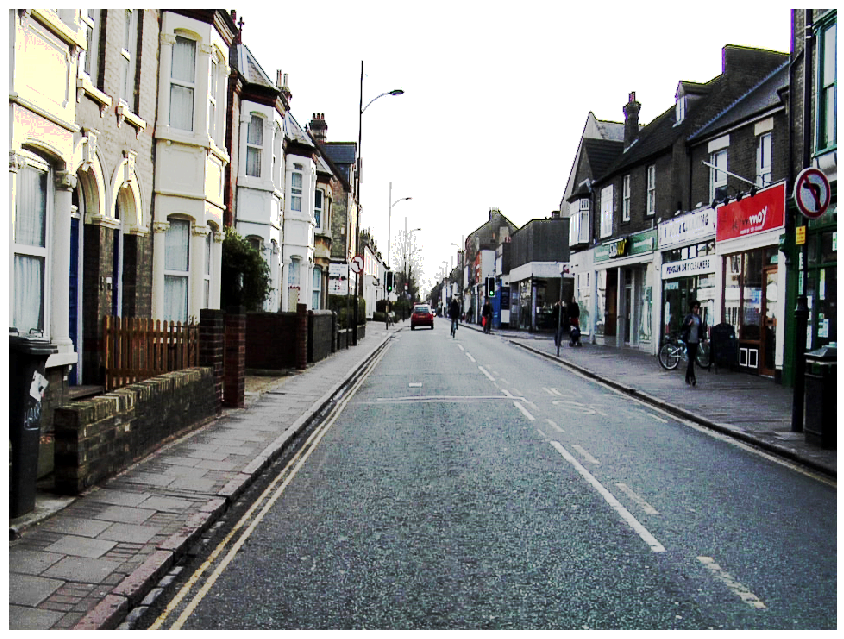
훈련된 클래스를 포함하는 영상을 읽어들임
I = imread('highway.png'); |
영상의 크기를 신경망의 입력크기에 맞게 조정
inputSize = net.Layers(1).InputSize; I = imresize(I, inputSize(1:2)); |
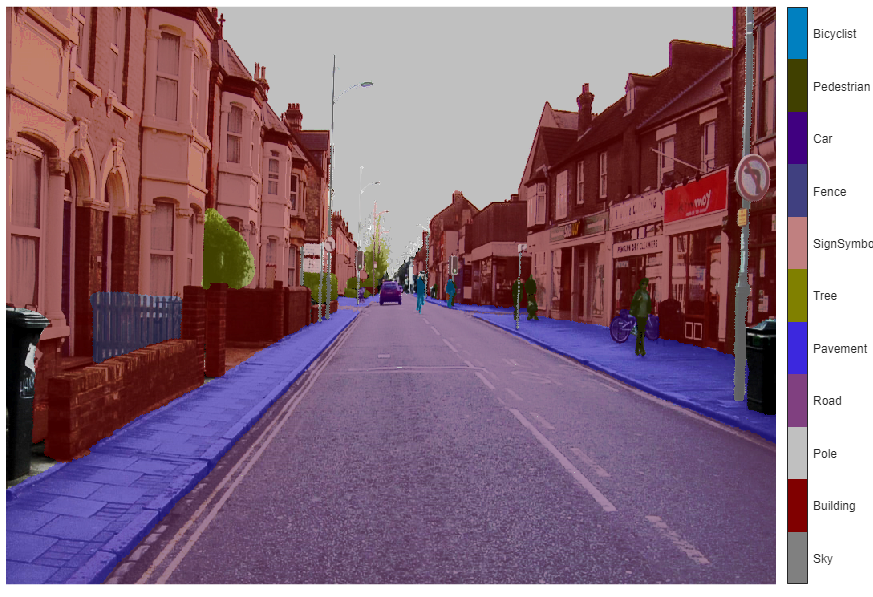
semanticseg 함수와 사전훈련된 신경망을 사용하여 semantic segmentation을 수행
C = semanticseg(I,net); |
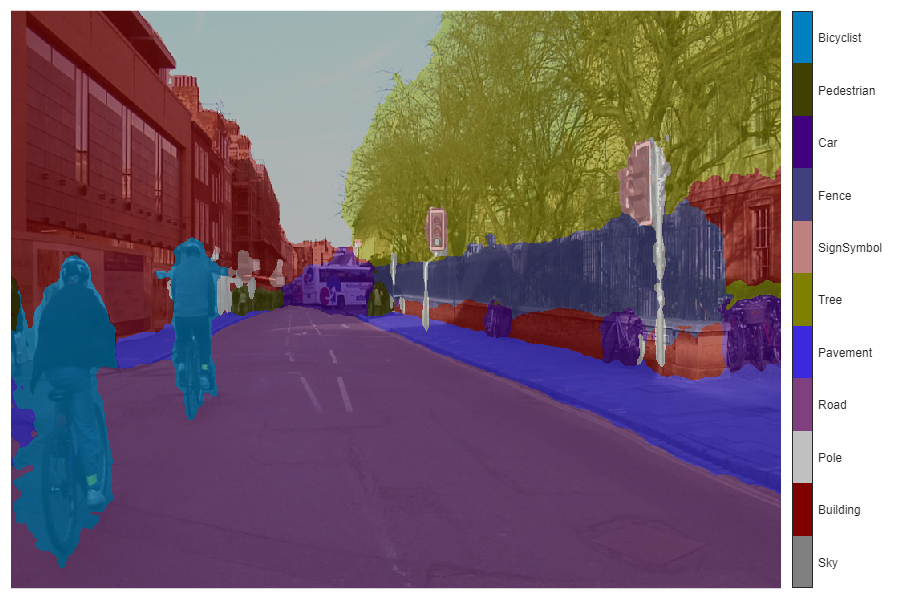
labeloverlay를 사용하여 분할결과를 영상위에 겹쳐놓음.
cmap = camvidColorMap; B = labeloverlay(I,C,'Colormap',cmap, 'Transparency',0.4); figure imshow(B) pixelLabelColorbar(cmap, classes); |
ㅡㅡㅡㅡㅡㅡㅡㅡㅡㅡㅡㅡㅡㅡㅡㅡㅡㅡㅡㅡㅡㅡㅡㅡㅡㅡㅡㅡㅡㅡㅡㅡㅡㅡㅡㅡㅡㅡㅡㅡㅡㅡㅡㅡㅡㅡㅡㅡㅡㅡㅡㅡㅡ
4. 의미론적 분할 신경망 훈련
resnet18; |
5. CamVid 데이터셋 다운로드
(오래 걸리므로 주의)
imageURL = 'http://web4.cs.ucl.ac.uk/staff/g.brostow/MotionSegRecData/files/701_StillsRaw_full.zip'; labelURL = 'http://web4.cs.ucl.ac.uk/staff/g.brostow/MotionSegRecData/data/LabeledApproved_full.zip'; outputFolder = fullfile(tempdir,'CamVid'); labelsZip = fullfile(outputFolder,'labels.zip'); imagesZip = fullfile(outputFolder,'images.zip'); if ~exist(labelsZip, 'file') || ~exist(imagesZip,'file') mkdir(outputFolder) disp('Downloading 16 MB CamVid dataset labels...'); websave(labelsZip, labelURL); unzip(labelsZip, fullfile(outputFolder,'labels')); disp('Downloading 557 MB CamVid dataset images...'); websave(imagesZip, imageURL); unzip(imagesZip, fullfile(outputFolder,'images')); end |
CamVid 영상 불러오기
imgDir = fullfile(outputFolder, 'images', '701_StillsRaw_full'); imds = imageDatastore(imgDir); |
영상 하나 표시
I = readimage(imds, 559); I = histeq(I); imshow(I) |
픽셀에 레이블이 지정된 CamVid 영상 불러오기
CamVid에 포함된 32개의 원본 클래스를 11개의 클래스로 그룹화
classes = [ "Sky" "Building" "Pole" "Road" "Pavement" "Tree" "SignSymbol" "Fence" "Car" "Pedestrian" "Bicyclist" ]; |
그룹화된 레이블 ID를 지원함수 camvidPixelLabelIDs를 사용하여 반환함
labelIDs = camvidPixelLabelIDs(); |
클래스와 레이블 ID를 사용하여 pixelLabelDatastore를 만듦
labelDir = fullfile(outputFolder, 'labels'); pxds = pixelLabelDatastore(labelDir, classes, labelIDs); |
픽셀에 레이블이 지정된 영상 중 하나를 읽어들이고 영상 위에 중첩하여 표시
C = readimage(pxds, 559); cmap = camvidColorMap; B = labeloverlay(I, C, 'ColorMap', cmap); imshow(B) pixelLabelColorbar(cmap, classes); |
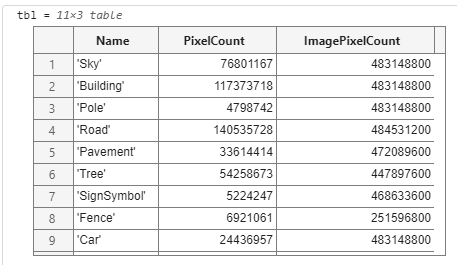
6. 데이터 통계량 분석
CamVid 데이터셋의 클래스 레이블의 분포 확인
tbl = countEachLabel(pxds) |
클래스별 픽셀 개수를 시각화
frequency = tbl.PixelCount/sum(tbl.PixelCount); bar(1:numel(classes),frequency) xticks(1:numel(classes)) xticklabels(tbl.Name) xtickangle(45) ylabel('Frequency') |

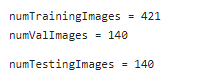
7. 훈련세트, 검증세트, 테스트세트 준비
[imdsTrain, imdsVal, imdsTest, pxdsTrain, pxdsVal, pxdsTest] = partitionCamVidData(imds, pxds); numTrainingImages = numel(imdsTrain.Files) numValImages = numel(imdsVal.Files) numTestingImages = numel(imdsTest.Files) |
8. 신경망 만들기
deeplabv3plusLayers 함수를 사용해서 ResNet18 기반으로 하는 DeepLab v3 + 신경망을 만듦.
imageSize = [720 960 3]; numClasses = numel(classes); lgraph = deeplabv3plusLayers(imageSize, numClasses, 'resnet18'); |
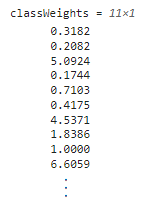
클래스 가중치를 사용하여 클래스 간의 균형 맞추기
imageFreq = tbl.PixelCount ./ tbl.ImagePixelCount; classWeights = median(imageFreq) ./ imageFreq |
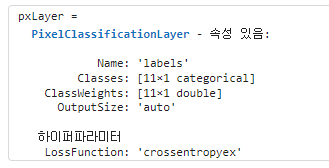
pixelClassification을 사용해서 클래스 가중치를 지정
pxLayer = pixelClassificationLayer('Name', 'labels', 'Classes', tbl.Name, 'ClassWeights', classWeights) lgraph = replaceLayer(lgraph, 'classification', pxLayer); |
9. 훈련 옵션 선택
훈련에 사용되는 최적화 알고리즘은 SGDM(모멘텀을 사용한 확률적 경사하강법). trainingOptions를 사용해서 SGDM에
사용할 하이퍼 파라미터를 지정.
dsVal = combine(imdsVal, pxdsVal); options = trainingOptions('sgdm', ... 'LearnRateSchedule','piecewise',... 'LearnRateDropPeriod',10,... 'LearnRateDropFactor',0.3,... 'Momentum',0.9, ... 'InitialLearnRate',1e-3, ... 'L2Regularization',0.005, ... 'ValidationData',dsVal,... 'MaxEpochs',30, ... 'MiniBatchSize',8, ... 'Shuffle','every-epoch', ... 'CheckpointPath', tempdir, ... 'VerboseFrequency',2,... 'Plots','training-progress',... 'ValidationPatience', 4); |
10. 데이터 증강
dsTrain = combine(imdsTrain, pxdsTrain); xTrans = [-10 10]; yTrans = [-10 10]; dsTrain = transform(dsTrain, @(data)augmentImageAndLabel(data,xTrans,yTrans)); |
11. 훈련 하기
doTraining = false; if doTraining [net, info] = trainNetwork(dsTrain, lgraph, options); end |
한 개 영상으로 신경망 테스트하기
I = readimage(imdsTest, 35); C = semanticseg(I, net); |
결과를 표시
B = labeloverlay(I, C, 'Colormap', cmap, 'Transparency', 0.4); imshow(B) pixelLabelColorbar(cmap, classes); |
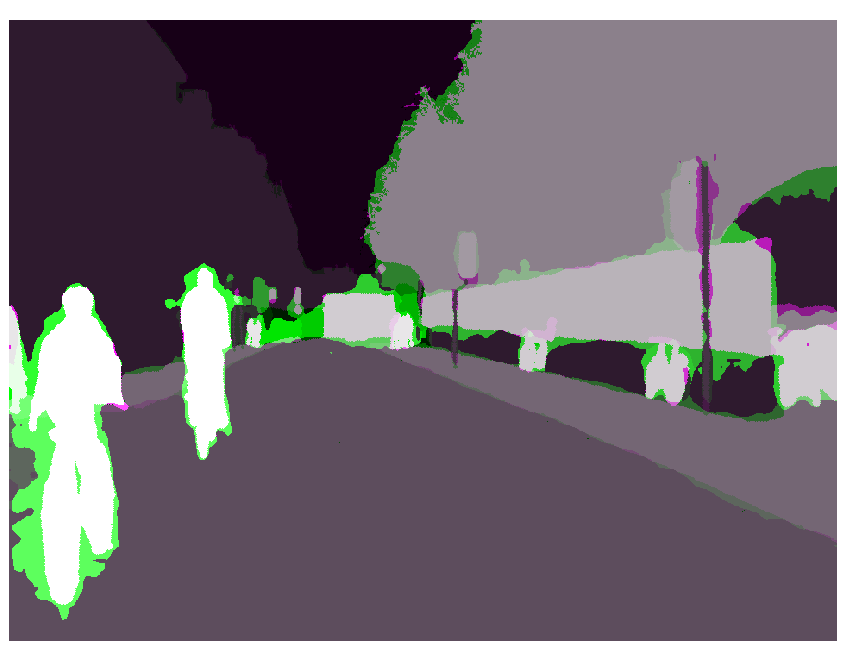
C의 결과를 pxdsTest에 저장된 예상 실측과 비교함
expectedResult = readimage(pxdsTest, 35); actual = uint8(C); expected = uint8(expectedResult); imshowpair(actual, expected) |
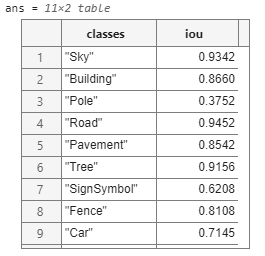
IoU의 측정
iou = jaccard(C, expectedResult); table(classes,iou) |
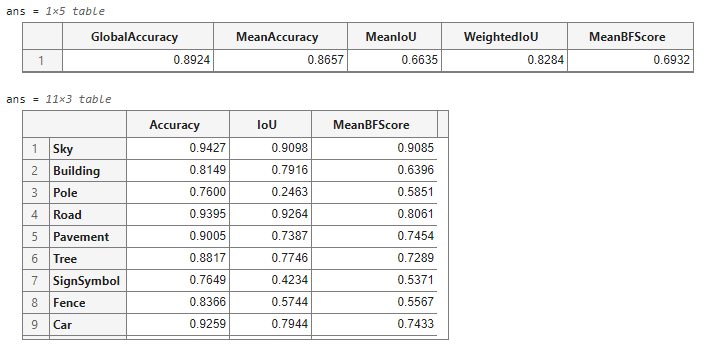
12. 훈련된 신경망 평가
pxdsResults = semanticseg(imdsTest,net, ... 'MiniBatchSize',4, ... 'WriteLocation',tempdir, ... 'Verbose',false); metrics = evaluateSemanticSegmentation(pxdsResults, pxdsTest, 'Verbose', false); metrics.DataSetMetrics metrics.ClassMetrics |
13. 지원함수
function labelIDs = camvidPixelLabelIDs() % Return the label IDs corresponding to each class. % % The CamVid dataset has 32 classes. Group them into 11 classes following % the original SegNet training methodology [1]. % % The 11 classes are: % "Sky" "Building", "Pole", "Road", "Pavement", "Tree", "SignSymbol", % "Fence", "Car", "Pedestrian", and "Bicyclist". % % CamVid pixel label IDs are provided as RGB color values. Group them into % 11 classes and return them as a cell array of M-by-3 matrices. The % original CamVid class names are listed alongside each RGB value. Note % that the Other/Void class are excluded below. labelIDs = { ... % "Sky" [ 128 128 128; ... % "Sky" ] % "Building" [ 000 128 064; ... % "Bridge" 128 000 000; ... % "Building" 064 192 000; ... % "Wall" 064 000 064; ... % "Tunnel" 192 000 128; ... % "Archway" ] % "Pole" [ 192 192 128; ... % "Column_Pole" 000 000 064; ... % "TrafficCone" ] % Road [ 128 064 128; ... % "Road" 128 000 192; ... % "LaneMkgsDriv" 192 000 064; ... % "LaneMkgsNonDriv" ] % "Pavement" [ 000 000 192; ... % "Sidewalk" 064 192 128; ... % "ParkingBlock" 128 128 192; ... % "RoadShoulder" ] % "Tree" [ 128 128 000; ... % "Tree" 192 192 000; ... % "VegetationMisc" ] % "SignSymbol" [ 192 128 128; ... % "SignSymbol" 128 128 064; ... % "Misc_Text" 000 064 064; ... % "TrafficLight" ] % "Fence" [ 064 064 128; ... % "Fence" ] % "Car" [ 064 000 128; ... % "Car" 064 128 192; ... % "SUVPickupTruck" 192 128 192; ... % "Truck_Bus" 192 064 128; ... % "Train" 128 064 064; ... % "OtherMoving" ] % "Pedestrian" [ 064 064 000; ... % "Pedestrian" 192 128 064; ... % "Child" 064 000 192; ... % "CartLuggagePram" 064 128 064; ... % "Animal" ] % "Bicyclist" [ 000 128 192; ... % "Bicyclist" 192 000 192; ... % "MotorcycleScooter" ] }; end |
|
function pixelLabelColorbar(cmap, classNames) % Add a colorbar to the current axis. The colorbar is formatted % to display the class names with the color. colormap(gca,cmap) % Add colorbar to current figure. c = colorbar('peer', gca); % Use class names for tick marks. c.TickLabels = classNames; numClasses = size(cmap,1); % Center tick labels. c.Ticks = 1/(numClasses*2):1/numClasses:1; % Remove tick mark. c.TickLength = 0; end |
|
function cmap = camvidColorMap() % Define the colormap used by CamVid dataset. cmap = [ 128 128 128 % Sky 128 0 0 % Building 192 192 192 % Pole 128 64 128 % Road 60 40 222 % Pavement 128 128 0 % Tree 192 128 128 % SignSymbol 64 64 128 % Fence 64 0 128 % Car 64 64 0 % Pedestrian 0 128 192 % Bicyclist ]; % Normalize between [0 1]. cmap = cmap ./ 255; end |
|
function [imdsTrain, imdsVal, imdsTest, pxdsTrain, pxdsVal, pxdsTest] = partitionCamVidData(imds,pxds) % Partition CamVid data by randomly selecting 60% of the data for training. The % rest is used for testing. % Set initial random state for example reproducibility. rng(0); numFiles = numel(imds.Files); shuffledIndices = randperm(numFiles); % Use 60% of the images for training. numTrain = round(0.60 * numFiles); trainingIdx = shuffledIndices(1:numTrain); % Use 20% of the images for validation numVal = round(0.20 * numFiles); valIdx = shuffledIndices(numTrain+1:numTrain+numVal); % Use the rest for testing. testIdx = shuffledIndices(numTrain+numVal+1:end); % Create image datastores for training and test. trainingImages = imds.Files(trainingIdx); valImages = imds.Files(valIdx); testImages = imds.Files(testIdx); imdsTrain = imageDatastore(trainingImages); imdsVal = imageDatastore(valImages); imdsTest = imageDatastore(testImages); % Extract class and label IDs info. classes = pxds.ClassNames; labelIDs = camvidPixelLabelIDs(); % Create pixel label datastores for training and test. trainingLabels = pxds.Files(trainingIdx); valLabels = pxds.Files(valIdx); testLabels = pxds.Files(testIdx); pxdsTrain = pixelLabelDatastore(trainingLabels, classes, labelIDs); pxdsVal = pixelLabelDatastore(valLabels, classes, labelIDs); pxdsTest = pixelLabelDatastore(testLabels, classes, labelIDs); end |
|
function data = augmentImageAndLabel(data, xTrans, yTrans) % Augment images and pixel label images using random reflection and % translation. for i = 1:size(data,1) tform = randomAffine2d(... 'XReflection',true,... 'XTranslation', xTrans, ... 'YTranslation', yTrans); % Center the view at the center of image in the output space while % allowing translation to move the output image out of view. rout = affineOutputView(size(data{i,1}), tform, 'BoundsStyle', 'centerOutput'); % Warp the image and pixel labels using the same transform. data{i,1} = imwarp(data{i,1}, tform, 'OutputView', rout); data{i,2} = imwarp(data{i,2}, tform, 'OutputView', rout); end end |